

June 29, 2020
Measuring traffic performance during COVID-19
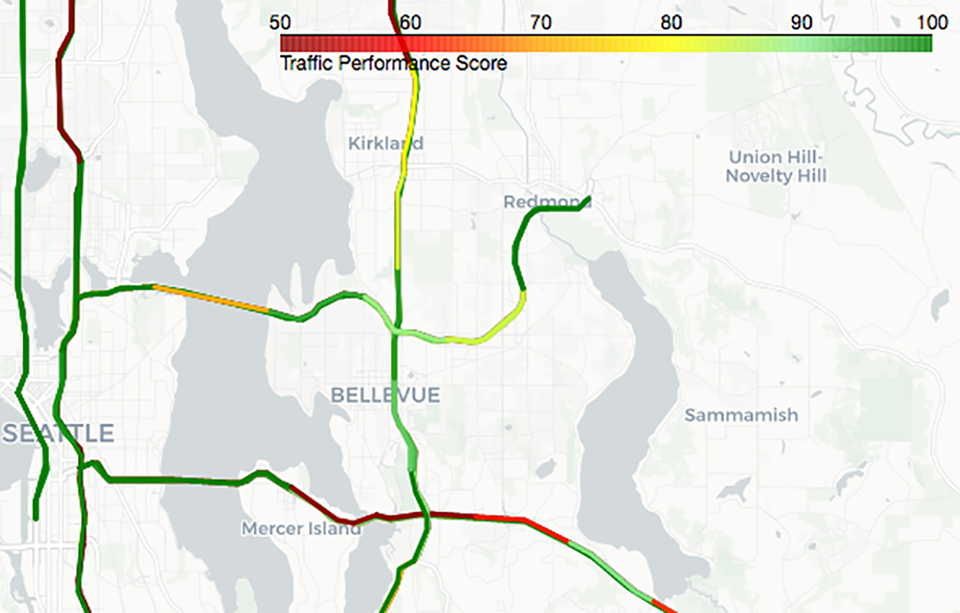
It’s not a surprise that traffic, like many things, has been impacted by COVID-19. But by how much? Researchers in UW CEE’s STAR Lab now have an answer to that question after employing a new scoring algorithm they developed to measure fluctuations in traffic. The researchers devised a metric called the Traffic Performance Score (TPS), which they applied to the greater Seattle area freeway network. A perfect score of 100% means that roadway users can travel at free-flow speed without encountering any traffic slowing or congestion. According to this assessment, traffic in Seattle during peak travel times has been drastically impacted by COVID-19, with congestion improving more than 70% in some instances. For example, a month before tech companies asked workers to stay home, the TPS for various stretches of roadway during morning rush hour on I-5 and I-405 was as low as 27%. Following the stay at home order on March 23, the TPS on the same segments of roadway was 100%. The researchers also hope the TPS data will inform a variety of important questions, from optimal commute times to how extreme weather or sporting events impact traffic. The web site allows users to input specific dates and times to determine TPS scores for various segments of roadway. Learn more: tps.uwstarlab.org.
Warmer temperatures increase arsenic levels in rice
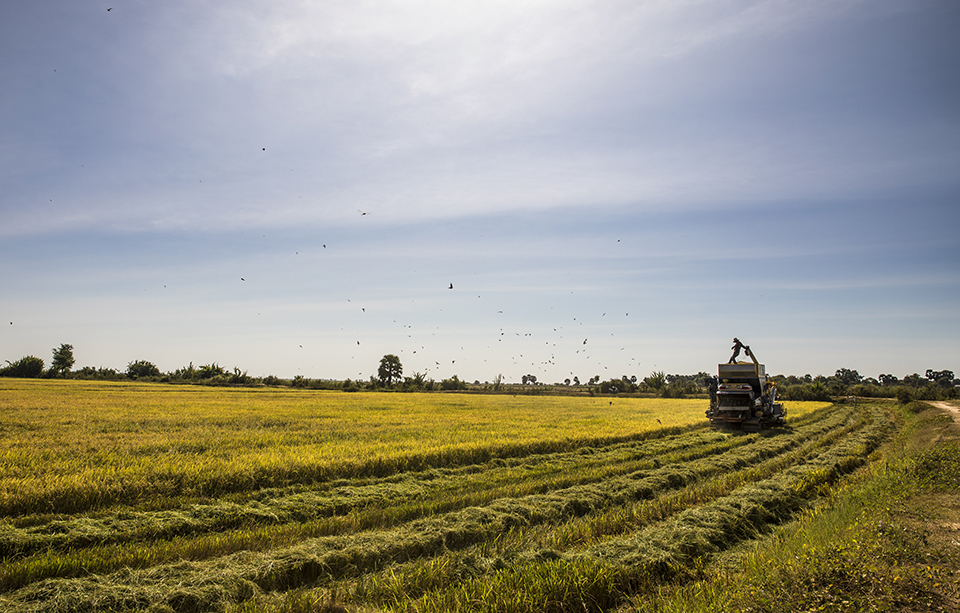
People around the world consume rice in their daily diets. But in addition to its nutrient and caloric content, rice can contain small amounts of arsenic, which in large doses is a toxin linked to multiple health conditions and dietary-related cancers. UW researchers including faculty Rebecca Neumann and Stuart Strand have found that warmer temperatures, at levels expected under most climate change projections, can lead to higher concentrations of arsenic in rice grains. Arsenic occurs naturally in the soil, though its concentration is higher in areas that have historically used arsenic-based herbicides or where irrigation water contains arsenic. When farmers grow crops such as rice under flooded conditions, arsenic is drawn out of the soil and into the water. To conduct their analysis, the researchers compared arsenic uptake under four different temperature conditions. As the temperature increased, the team saw increased uptake of arsenic by every part of the rice plant, including the grains. Since some forms of arsenic are more toxic than others, the team is now collaborating with researchers at UW Tacoma to develop a method to determine what forms of arsenic are in different parts of the plant. This will enable them to get a better picture of potential health risks.
SeaTac Airport air pollution path identified

The community surrounding Seattle-Tacoma International Airport, which is the eighth busiest airport in the U.S., has long wondered if air pollution caused by aircraft is reaching nearby residential areas. Thanks to a team of UW researchers, including professor Tim Larson, new findings have officially landed. For the first time at SeaTac Airport, the researchers have identified a distinct type of ultrafine particle pollution associated with aircraft. Ultrafine particles, which are less than 0.1 micron in diameter, are readily inhaled and can penetrate across traditional membrane barriers in the body, according to separate health-related studies. Because ultrafine particle pollution can be produced from various sources — for example, traffic on freeways near airports as well as jets overhead — it can be difficult to distinguish its exact origin. To study the SeaTac Airport area, researchers looked to a similar study conducted at Los Angeles International Airport and took into account the unique terrain and wind patterns of SeaTac Airport. To address these variables, the researchers set-up mobile monitoring platforms in addition to fixed monitoring locations. They also tracked the direction of flights and other details using data from the Federal Aviation Administration. The researchers were able to identify unique “fingerprints” for the two types of ultrafine particles and successfully mapped the corresponding “footprints” of each type of air pollution.
What’s in Puget Sound? New technique casts a wide net for concerning chemicals
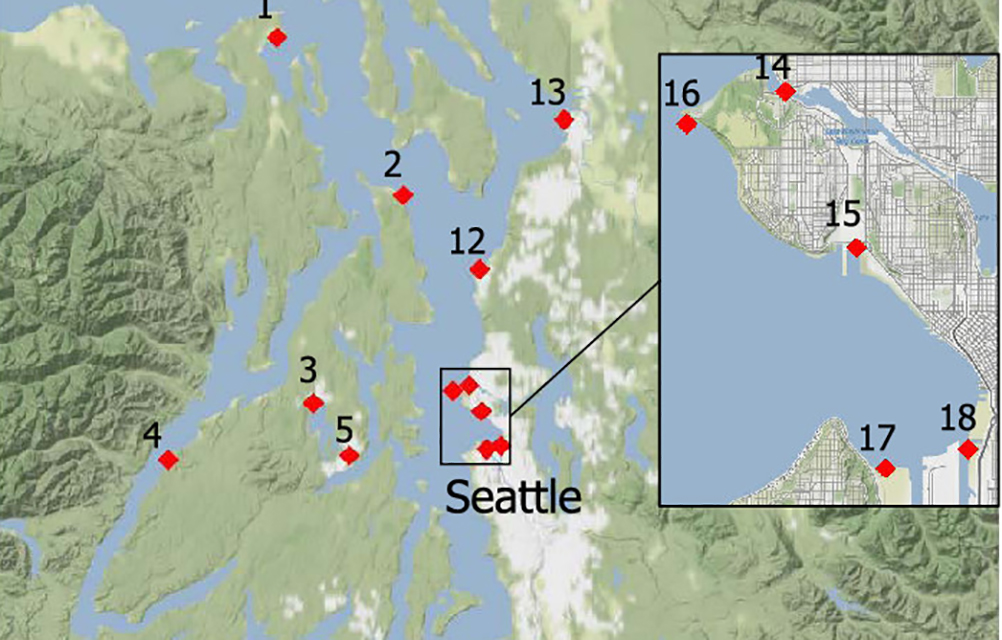
The waters of Puget Sound support many species, including mussels, salmon and killer whales, which are vulnerable to runoff from land that may contain chemicals. Although chemicals of known concern are already tracked, until recently there was no way to find out if other potentially harmful compounds are also present in the water. UW researchers including associate professor Edward Kolodziej screened samples from multiple regions of Puget Sound to look for additional concerning chemicals. The team identified 64 chemicals never detected before in the waterway, eight of which were at potentially hazardous concentrations. Water samples were collected at 18 sites multiple times during 2018. The researchers then used a method called high-resolution mass spectrometry to help identify the chemicals in each sample. They found at least 205 different chemicals across all samples and were able to confirm the identity of 75 chemicals, of which 64 were reported for the first time. The 75 confirmed chemicals included pesticides, herbicides, food additives and pharmaceuticals — antidepressants and blood pressure medications, for example — and compounds related to vehicles, such as tire rubber chemicals. The next step for the researchers is to explore how marine life may be impacted and to further investigate the eight concerning chemicals.
Hydropower dams cool rivers in the Mekong River basin, satellites show
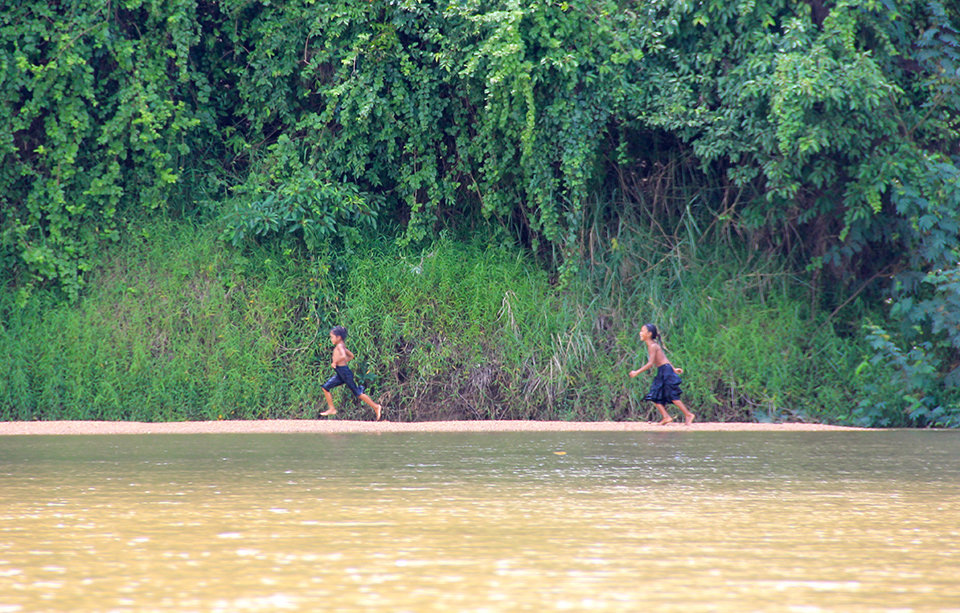
Hydropower dams, which use flowing water to turn a series of turbines to generate electricity, provide a source of energy that doesn’t rely on fossil fuels. UW researchers including professor Faisal Hossain, Matthew Bonnema, who completed this research as a UW CEE graduate student, and research professor Bart Nijssen studied how several hydropower dams affected the temperature of three major rivers in Southeast Asia’s Mekong River basin. The Sekong, Sesan and Srepok rivers combine into one river, which eventually enters the Mekong River, a central feature of the Southeast Asian ecosystem which people rely on for fish and irrigation for rice and other crops. Since 2001, each river has seen the construction of at least one major dam, with more planned. Using 30 years of satellite data, the team discovered that within one year of the opening of a major dam, downstream river temperatures during the dry season dropped by up to 3.6 degrees F (2 degrees C). The cooling persisted where the rivers meet the Mekong River, which showed, at most, a 1.4 F (0.8 C) cooling. To conduct the study, the researchers used Landsat satellites to capture the heat, or infrared radiation, from the rivers, which they then used to track changes in surface water temperature. The cooler water may have an effect on fish that live downstream, according to the researchers.
Researchers explore the changing Arctic to improve climate models
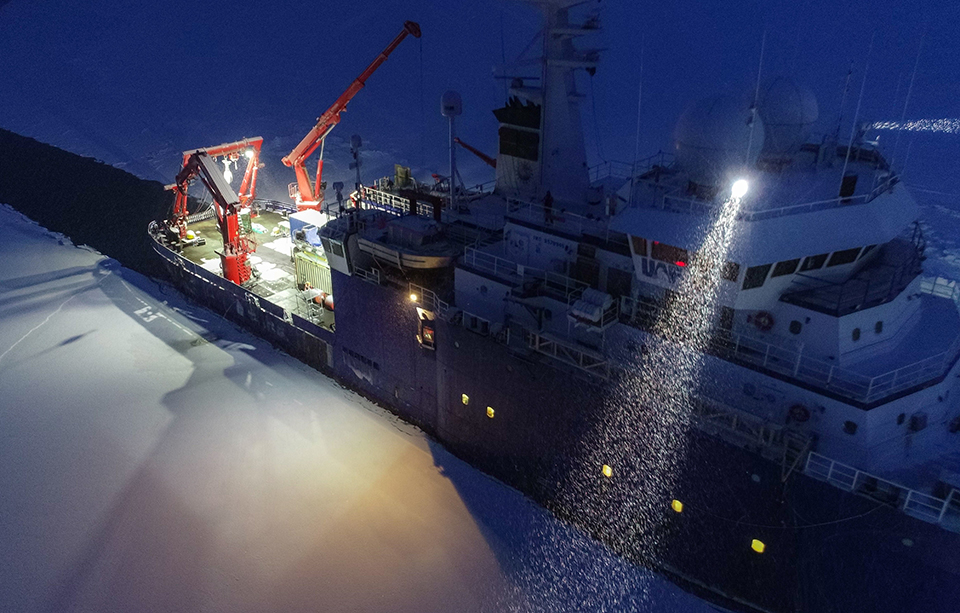
Information about the role that waves play in the changing Arctic is rolling in, so to speak, after UW researchers spent a month at sea collecting data. The critical connection between melting sea ice, increasingly powerful waves and eroding coastlines has been missing from existing research in the Arctic. To help fill this knowledge gap, a team of researchers including faculty member and Applied Physics Laboratory oceanographer Jim Thomson and assistant professor Nirnimesh Kumar set sail aboard the Sikuliaq last November. The role that waves play in the erosion of Arctic coastlines is directly related to diminishing sea ice, which is at record low levels, according to the researchers. Sea ice has historically helped to protect the coast from powerful waves and turbulent storms, as more open water can lead to stronger waves as the distance over which the waves travel increases. With Arctic coastlines eroding at rates of meters per year, problems are already impacting the local communities that reside along the coast of Alaska where subsistence hunting and fishing is prevalent. By investigating the interactions between waves and sea ice and how they contribute to coastal erosion and flooding, the researchers hope to improve the accuracy of climate models, which can be used to inform more strategic climate policy decisions.
Democratizing data: New air pollution database
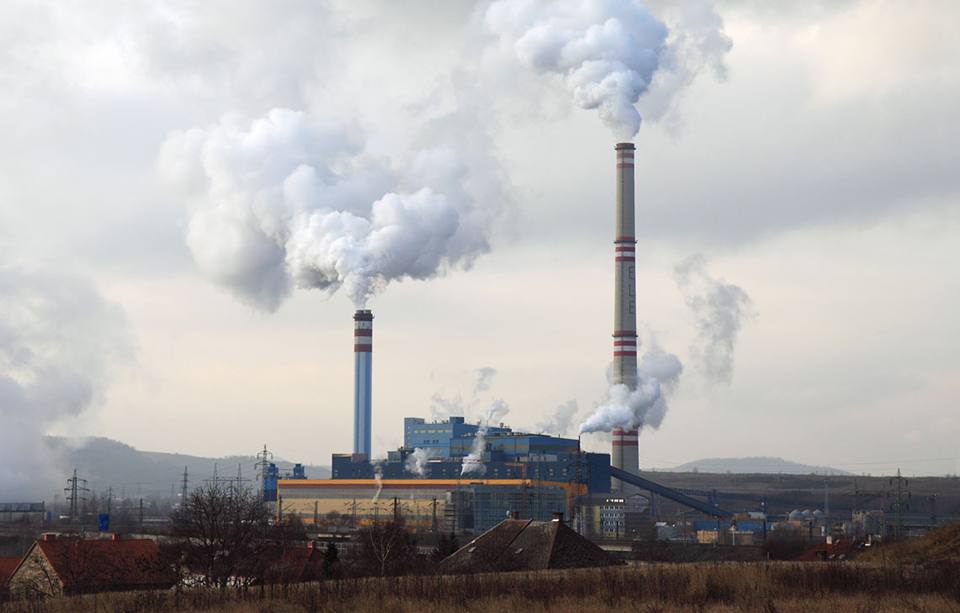
Air pollution knows no bounds. And now, neither does associated data. With the goal of democratizing air pollution data, professor Julian Marshall and graduate student Matthew Bechle, in collaboration with researchers at The Center for Air, Climate and Energy Solutions (CASES), helped launch a first-of-its-kind publicly available database that provides access to long-term information about air pollution concentrations and economic damages caused by human exposure to air pollution. With the goal of advancing air pollution research by increasing the number of researchers who can work with high-quality data, the database provides information to study the relationship between air pollution exposures and health and to document exposures and disparities over time. Data is available for six major pollutants for which the EPA has set concentration standards. The datasets are more extensive than previous studies, going back as far as 40 years for some pollutants. Previously, state-of-the-art modeling and policy analysis tools have typically only been available to researchers who have the knowledge and resources to develop them or through collaborations with such researchers. Learn more: https://www.caces.us/.