December 9, 2020
In light of the COVID-19 pandemic, several CEE faculty shifted their focus to working on projects aimed at creating and informing a more resilient community.
Detecting COVID-19 outbreaks through wastewater monitoring

A single pump station sample can reveal COVID-19 infection in a neighborhood of thousands of people.
To quickly and economically detect COVID-19 outbreaks, a CEE-led research team is working to introduce a testing system that utilizes wastewater samples from neighborhood pump stations, which has the potential to reduce the burden of individual testing.
“Across the world, people are thinking about using the sewer to check for the virus, but most focus on wastewater treatment plants, where the signal is very diluted as the wastewater comes together from all kinds of households and industrial facilities in the area,” says assistant professor Mari Winkler. “So, to locate the infection within a zip code, our idea was to check the pump stations.”
Located in neighborhoods, pump stations help transport and funnel raw sewage to larger wastewater treatment plants, which typically serve municipalities. By collecting samples before sewage from numerous neighborhoods converges, specific community outbreaks can be identified. For an even more close-up assessment, the researchers plan to collect samples from utility holes, which will facilitate monitoring at facilities such as hospitals, nursing homes and student housing.

A utility hole where wastewater is sampled.
This will be the first time this type of sampling system is implemented in Seattle. In addition to being more economical, the researchers say this sampling method can detect outbreaks faster than waiting for individuals to get tested. This method also could be a valuable tool for identifying hotspots for targeting and evaluating vaccination trials.
The project is being undertaken in collaboration with UW Department of Environmental & Occupational Health Sciences professor Scott Meschke, Public Health Seattle King County, King County Wastewater Division, Institute of Disease Modelling, Fred Hutchinson Cancer Research Center and Seattle COVID Assessment Network.
A mobility informed COVID-19 transmission model
A new COVID-19 transmission model is based on the theory that the number of infections increases with the average mobility.
A trip to the grocery store or a friend’s house may seem harmless enough, but the spread of COVID-19 is closely tied to people’s mobility. To help determine the level of travel that is safe for communities, as well as when an outbreak is likely to occur, researchers have developed a new type of mobility informed infectious disease model. It is already being used by the Centers for Disease Control and Prevention (CDC) to forecast COVID-19 deaths across the country.
“Overall mobility is measured by the number of places an average person visits in a day,” says professor Jeff Ban. “If a critical value is exceeded, our model will indicate an outbreak of more COVID-19 cases. Of course, public health measures such as social distancing and masks will change the critical value and other parameters of the model.”
Ban’s model — which he developed in collaboration with Yunfeng Shi, a materials science and engineering researcher at Rensselaer Polytechnic Institute — was inspired by the idea that simple chemical reactions, such as how molecules collide to form reactions, could be applied to forecasting COVID-19 transmission. Similar to how the likelihood of molecules colliding increases according to distance traveled, the researchers speculated that the risk of encountering someone infected with COVID-19 also increases the more a person travels.
Therefore, to control COVID-19 outbreaks, the average mobility over a period of time must be lower than a critical value, which varies by city and considers public health measures such as social distancing and city-wide mask usage. For example, the critical value was 30% of the pre-COVID average mobility for New York City and 60% of the pre-COVID average mobility for all other counties in New York in mid-March.
Although this is not the first COVID-19 transmission model that incorporates mobility, the researchers say it is unique in its simplicity and accuracy. The model incorporates two data sources: COVID-19 fatality data from Johns Hopkins University and mobility data from Google.
Scanning streets to document COVID-19
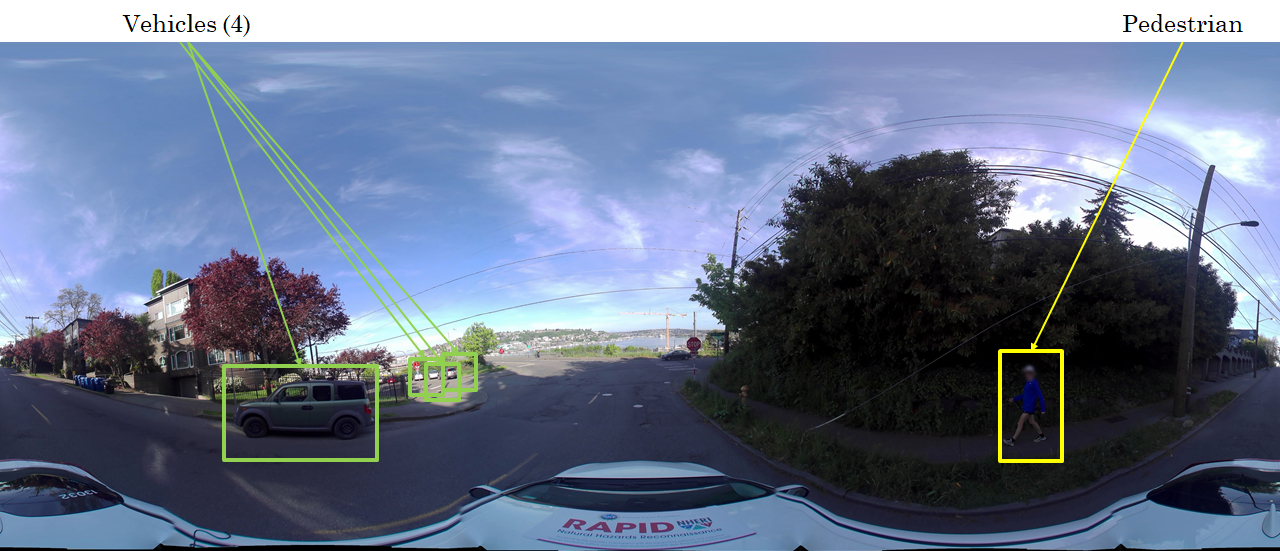
UW researchers scan the streets every few weeks to document how Seattle has reacted to the pandemic and what recovery looks like. Photo credit: University of Washington
Community resilience comes into play during natural disasters, such as earthquakes and hurricanes, but what about during a pandemic? To better understand factors that may contribute to community resilience during COVID-19, an interdisciplinary team of UW researchers including CEE professor Joe Wartman have hit the streets to track COVID-19 response over time.
To capture what’s happening in Seattle, and changes over time, the researchers are scanning the streets every few weeks using a car-mounted camera similar to Google Street View. The project started in May, following the city of Seattle’s shut-down in March 2020 to slow the spread of COVID-19. The team’s driving route, which takes around 10 hours to complete, was designed to capture different aspects of the city, from hospitals to restaurants to parks.
“This is an amazing tool for quickly gathering highly perishable data from across the city,” says Wartman, a co-lead on the project. “Unless we capture these scenes now, these sights — and the rich data they contain — will be lost forever.”
By scanning the streets, the researchers are collecting images that can be used to track changes over time: if people are outside, if they are social distancing, where they are gathering and how their activities change as the pandemic progresses. Since the camera creates large datasets, the researchers are developing algorithms to help identify people, vehicles and even if social distancing protocols are being followed. The project will continue until at least fall 2021.
“I can already see a significant difference between the May dataset and what’s happening now,” Wartman says. “For example, when we first drove past Harborview Medical Center, no one was present on the block. Now it’s beginning to look like it used to.”
Is the air getting cleaner during the COVID-19 pandemic?
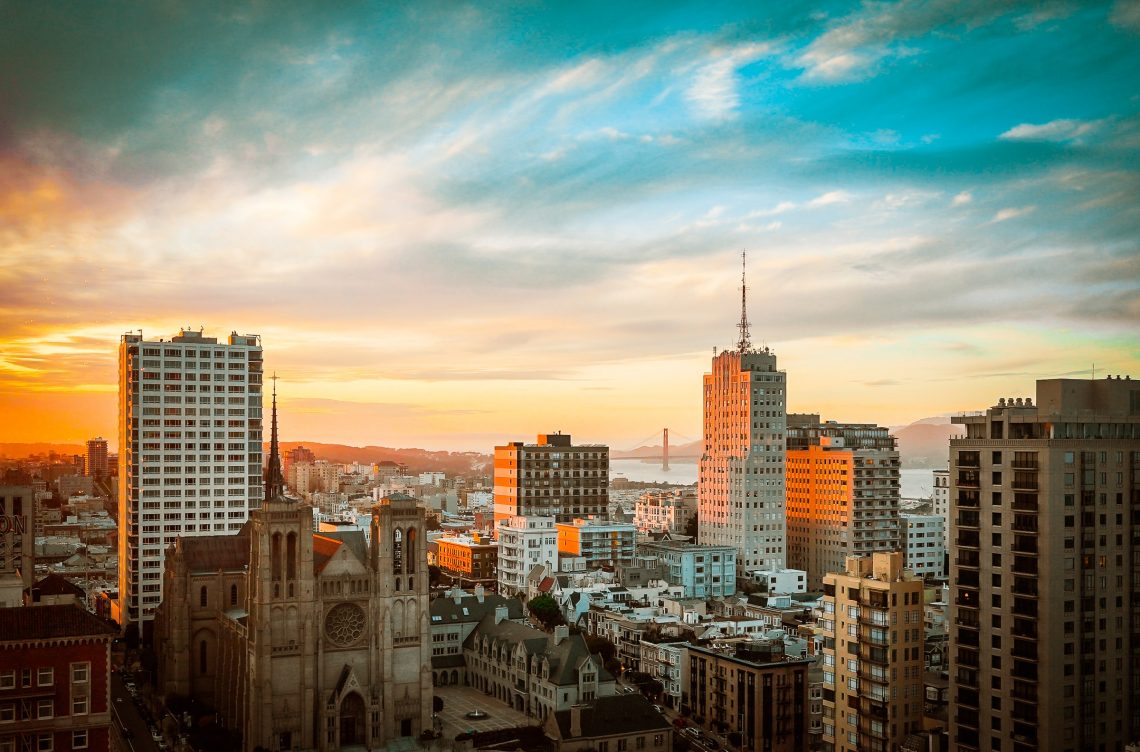
A University of Washington-led team investigated whether fewer cars on the road due to stay-at-home orders led to cleaner air. Photo credit: Sasha Stories / Unsplash
Starting in mid-March, many states issued stay-at-home orders or encouraged people to work from home to curb the spread of COVID-19. In cities nationwide, daily traffic dropped. But did fewer cars on the road lead to cleaner air? Not necessarily, according to a new study led by CEE researchers.
Using air quality data from U.S. Environmental Protection Agency monitors across the U.S., the researchers looked for changes in two common pollutants: ozone and fine particulate matter called PM2.5. Compared to the past 10 years, neither pollutant has been consistently lower than expected levels since stay-at-home orders began. But the team found that NO2 — a pollutant that mainly comes from car exhaust — was at much lower levels in Seattle, Los Angeles and New York. In these cities, it was 30% lower on average after stay-at-home orders were implemented.
“It’s difficult to determine whether the air really is cleaner now because there is a lot of variability in weather and emissions patterns,” says CEE professor Julian Marshall. “You can’t look solely at concentrations today and compare them to the same day a month or a year ago.”
Because pollutant concentrations vary over time and across regions, the researchers developed a method to determine whether pollutant levels in any given week were notably different from normal. The team’s “robust differences” metric compared a pollutant’s median concentration during a week in 2020 to its median concentration in the same time period over the past 10 years.
“Everybody thinks that because so many people are not driving the air is really clean, but it really depends on what type of pollution you’re talking about,” says Ph.D. student Bujin Bekbulat. “Cars are the main contributor to NO2 levels, which are down, so there’s something to people’s intuition. But we’re still using electricity, and power plants generate emissions. When it’s cold, people still burn fires, and that generates emissions. There are all kinds of things happening that could explain why we think we’re all shutting down, but pollution levels don’t show that.”